China (Mainland)
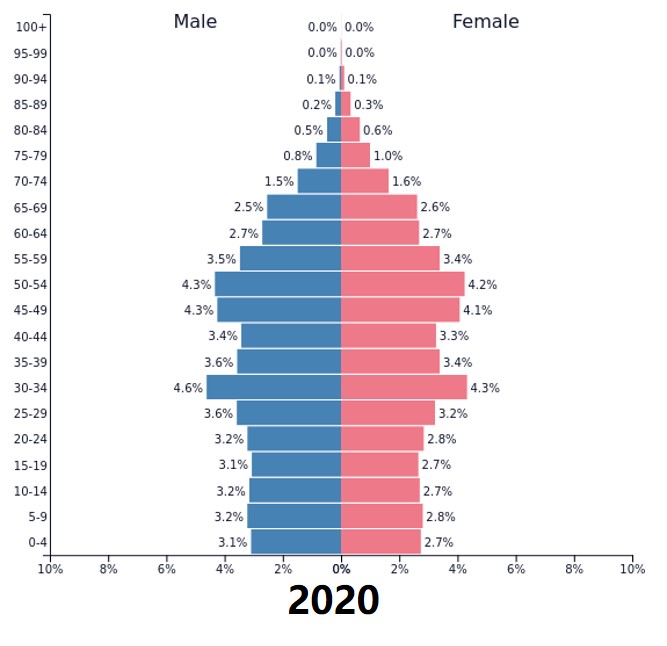
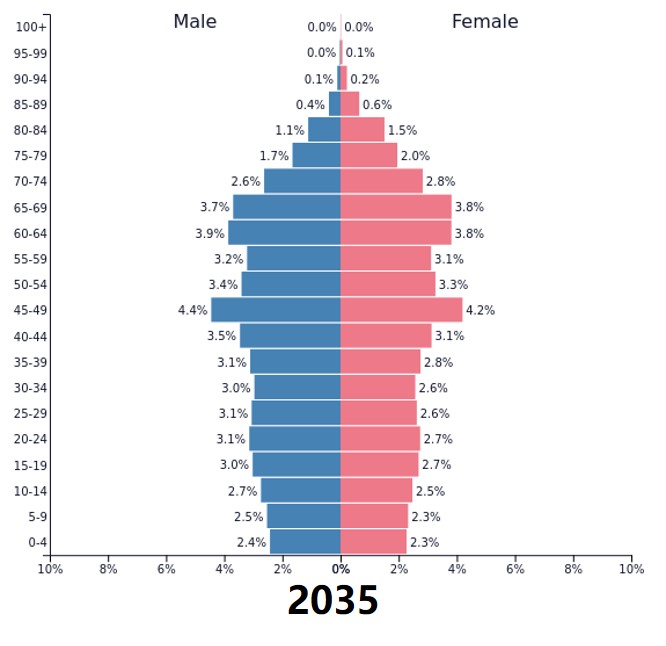
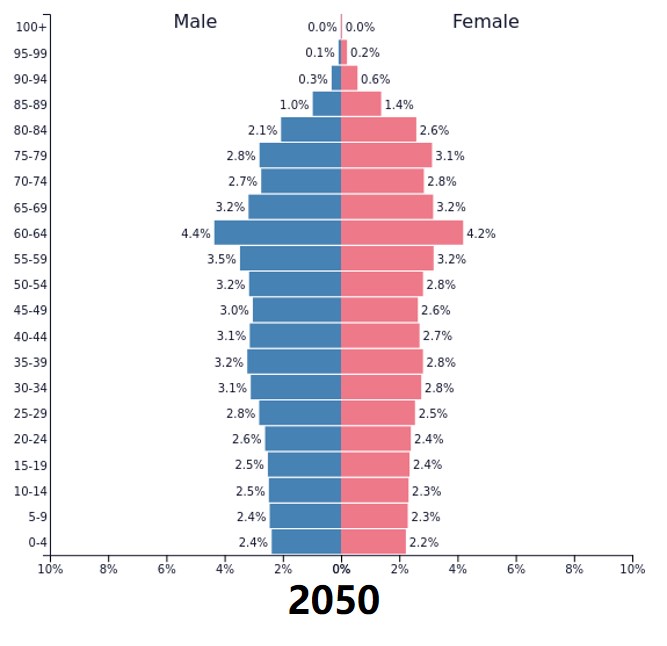
Population Pyramid
Aged Population
| Year | Total Population (million) | Population Aged 60 or Older (million) | Proportion of Population Aged 60 and Older (%) | Population Aged 65 or Older (million) | Proportion of Population Aged 65 and Older (%) | Dependency Ratio for the Elderly (%) |
| 2000 | 1,265.83 | —— | —— | 88.11 | 7.0% | 9.9% |
| 2001 | 1,276.27 | —— | —— | 90.62 | 7.1% | 10.1% |
| 2002 | 1,284.53 | —— | —— | 93.77 | 7.3% | 10.4% |
| 2003 | 1,292.27 | —— | —— | 96.92 | 7.5% | 10.7% |
| 2004 | 1,299.88 | —— | —— | 98.57 | 7.6% | 10.7% |
| 2005 | 1,307.56 | —— | —— | 100.55 | 7.7% | 10.7% |
| 2006 | 1,314.48 | 149.01 | 11.3% | 103.84 | 7.9% | 10.9% |
| 2007 | 1,321.29 | 153.40 | 11.6% | 107.02 | 8.1% | 11.2% |
| 2008 | 1,328.02 | 159.89 | 12.0% | 110.23 | 8.3% | 11.4% |
| 2009 | 1,334.50 | 167.14 | 12.5% | 113.43 | 8.5% | 11.6% |
| 2010 | 1,340.91 | 177.65 | 13.3% | 119.34 | 8.9% | 11.9% |
| 2011 | 1,349.16 | 184.99 | 13.7% | 122.77 | 9.1% | 12.2% |
| 2012 | 1,359.22 | 193.90 | 14.3% | 127.77 | 9.4% | 12.7% |
| 2013 | 1,367.26 | 202.43 | 14.9% | 132.62 | 9.7% | 13.1% |
| 2014 | 1,376.46 | 212.42 | 15.5% | 139.02 | 10.1% | 13.8% |
| 2015 | 1,383.26 | 222.00 | 16.1% | 144.76 | 10.5% | 14.3% |
| 2016 | 1,392.32 | 230.86 | 16.7% | 150.37 | 10.8% | 14.9% |
| 2017 | 1,400.11 | 240.90 | 17.3% | 159.61 | 11.4% | 15.9% |
| 2018 | 1,405.41 | 249.49 | 17.9% | 167.24 | 11.9% | 16.7% |
| 2019 | 1,410.08 | 253.88 | 18.1% | 177.25 | 12.6% | 17.8% |
| 2020 | 1,411.78 | 264.01 | 18.7% | 190.59 | 13.5% | 19.7% |
| 2021 | ||||||
| 2022 | ||||||
| 2023 | ||||||
| 2024 | ||||||
| 2025 |
